Supported visualisation types
The following chart types support the Turas data visualisation principles and are suitable for most use cases:
- column chart: compare values across categories
- horizontal bar chart: compare values when labels are long
- line chart: show trends and changes over time
- 100% stacked bar chart: compare proportions that add up to 100%
- scatter plot: show relationships between two variables
Where possible include the option to view the data in a table as well as a chart. This allows users to find precise values. It also provides an accessible alternative for users who need detailed numerical information.
Other visualisation patterns
Progress indicators
Progress indicators are not charts, but they are commonly used in dashboards and data visualisations to communicate progress, status and performance.
Use progress indicators to show progress towards a known total, target or benchmark. They work well for:
- completion percentages
- progress towards a target
- adoption or compliance rates
- performance against a threshold
Progress indicators are an HTML component. If used in websites or applications, they must use accessible markup and meet WCAG 2.2 requirements. Progress indicators should expose their label, current value, minimum value and maximum value to assistive technologies.
When using progress indicators:
- always show the current value as text alongside the visual indicator
- make the total, target or benchmark clear
- use accessible HTML and ensure the component is announced correctly by assistive technologies
- use sufficient colour contrast and do not rely on colour alone to communicate meaning
Chart types to avoid
Certain chart types are generally harder to interpret, compare and make accessible than simpler alternatives. When creating charts for Turas avoid:
- pie charts and donut charts: pie charts and donut charts make it difficult to compare angles and areas, making them hard to judge accurately
- 3D charts: distort data and make values appear larger or smaller than they really are
- radar (spider) charts: make comparisons difficult and are often unfamiliar to users
- Sankey and chord diagrams: become difficult to interpret as complexity increases
- packed bubble charts: users must compare circle sizes, which are difficult to judge accurately
Column chart
Use column charts to compare values across discrete categories. Start the vertical axis at zero to ensure differences between values are accurately represented. Order categories logically, such as highest to lowest value or by a meaningful sequence, to make comparisons easier. Label bars directly where possible and keep category names short enough to remain horizontal and readable.
Police Scotland was the most common source of adult support and protection referrals in 2024–25
Number of referrals from the five most common adult support and protection referral sources

Source: Scottish Government, Adult Support and Protection (ASP) National Minimum Dataset 2024-25
Figure 1. Example column chart using the categorical palette
Example alt text
Helpful alt text focused on the key insight:
Police Scotland was the most common source of adult support and protection referrals in 2024–25, with 14,626 referrals. Care homes were the second most common source with 11,476 referrals. All other referral sources recorded fewer than 5,000 referrals.
Why this works
The column chart in Figure 1 follows best practice because it:
- orders data logically, making comparisons quick and easy
- starts the vertical axis at zero to avoid exaggerating differences
- places values above the bars so users can read exact figures without estimating
- uses a simple, uncluttered layout that focuses attention on the data
- uses a clear title and subtitle that describe the information shown
- keeps labels horizontal and easy to read
- avoids unnecessary legends, borders and decorative elements
- maintains consistent spacing and alignment throughout the chart
Horizontal bar chart
Use horizontal bar charts when category labels are long or when comparing many categories. They are often easier to read than column charts because labels can remain horizontal without wrapping or rotation.
Most people who had not contacted a health professional reported managing symptoms themselves
Reasons for not contacting a health professional about menopause or perimenopause symptoms, 2024

Source: Scottish Government, The Scottish Health Survey 2024 - volume 1: main report
Figure 2. Example horizontal bar chart using the categorical palette
Example alt text
Helpful alt text focused on the key insight:
Most people who did not contact a health professional about menopause or perimenopause symptoms reported managing their symptoms themselves (58%). This was more than twice as common as any other reason.
Why this works
The horizontal bar chart in Figure 2 follows best practice because it:
- keeps category labels visible and easy to read
- orders values logically to support comparison
- places values on the chart so users can identify exact figures
- uses a simple colour scheme that does not rely on colour alone to communicate meaning
- presents information without requiring a legend
- includes clear titles and labels to provide context
- makes efficient use of available horizontal space
- allows users to compare the size of categories easily because bar lengths represent the underlying values and do not need to extend to 100%
Line chart
Use line charts to show trends, patterns and change over time. They work best when the horizontal axis represents a continuous sequence such as days, months, quarters or years. Avoid using line charts to compare unrelated categories.
Flu vaccination uptake increased in the most recent winter season after two years of decline
Percentage of healthcare workers and frontline social care workers receiving a flu vaccination each winter season

Source: Public Health Scotland (PHS); compiled from the PHS Vaccination Surveillance Dashboard, Annual Immunisation Reports, and Scottish Government CMO Winter Programme Directives
Figure 3. Example line graph
Example alt text
Helpful alt text focused on the key insight:
Flu vaccination uptake declined between 2022/23 and 2024/25 before increasing in 2025/26. Healthcare workers consistently reported higher uptake than frontline social care workers.
Why this works
The line chart in Figure 3 follows best practice because it:
- uses a continuous time scale to show changes over time
- makes it easy to compare trends between data series
- uses a manageable number of data series, keeping the chart easy to read and interpret
- combines colour, marker shapes and a legend so users can distinguish between data series without relying on colour
- includes clear titles, labels and contextual information to support interpretation
- uses a simple layout with minimal visual clutter, helping users focus on the data
- highlights patterns, trends and changes without requiring users to read every individual value
100% stacked bar chart
Use 100% stacked bar charts to compare proportions across groups. Ensure values either sum to 100% or communicate when they do not. Keep category ordering consistent across all bars to support comparison. Use 100% stacked column charts where a vertical layout is more appropriate.
Social care assessment outcomes by age group
Proportion of primary support types provided to clients (fictional data)

Figure 4. Example 100% stacked bar chart
Example alt text
Helpful alt text focused on the key insight:
Younger clients were more likely to return home with little or no support, while older clients were more likely to need residential care or rehabilitation services. Returning home with a formal social care package was the most common outcome across all age groups.
Why this works
The 100% stacked bar chart in Figure 4 follows best practice because it:
- uses a consistent 100% scale across all groups
- makes it easy to compare proportions rather than absolute values
- keeps category ordering consistent across each bar
- labels segments directly with percentages to reduce estimation
- uses the categorical palette in a consistent order
- positions the legend close to the chart so users can identify categories
- allows long category labels to wrap rather than truncating information
- uses a horizontal layout that adapts well to smaller screen sizes
- avoids excessive gridlines, borders and decorative elements
Scatter plot
Use scatter plots to explore relationships between two variables. They can help identify patterns, clusters and outliers within a dataset.
Relationship between training hours and assessment score
Fictional data used to demonstrate relationships and outliers
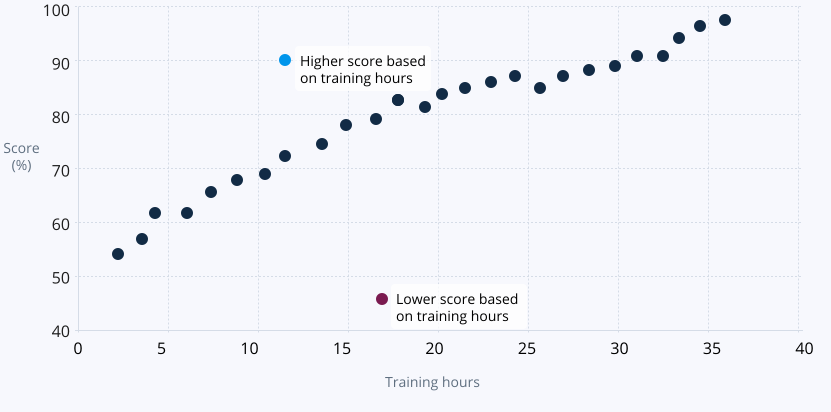
Figure 5. Example scatter plot
Example alt text
Assessment scores tend to rise as training hours increase. Two outliers are highlighted: one learner scored significantly higher and one significantly lower than other learners with similar training hours.
Why this works
The scatter plot in Figure 5 follows best practice because it:
- shows how individual observations relate to values on both axes, making relationships easier to identify
- clearly shows the relationship between two measures
- allows patterns and outliers to be identified quickly
- uses clearly visible gridlines to make it easier to compare values and identify patterns across the chart
- uses direct labels to identify notable data points without relying on a separate legend
- uses simple markers that remain distinguishable at different screen sizes
- labels axes clearly and includes units where appropriate
- avoids unnecessary decoration and visual clutter
- uses colour only where it adds meaningful context
- supports interpretation of the overall pattern in the data
References
Neilson Norman Group